
HFT Performance and Latency Visibility
Chronix is designed around a simple principle: speed and reliability are not solved in one place.
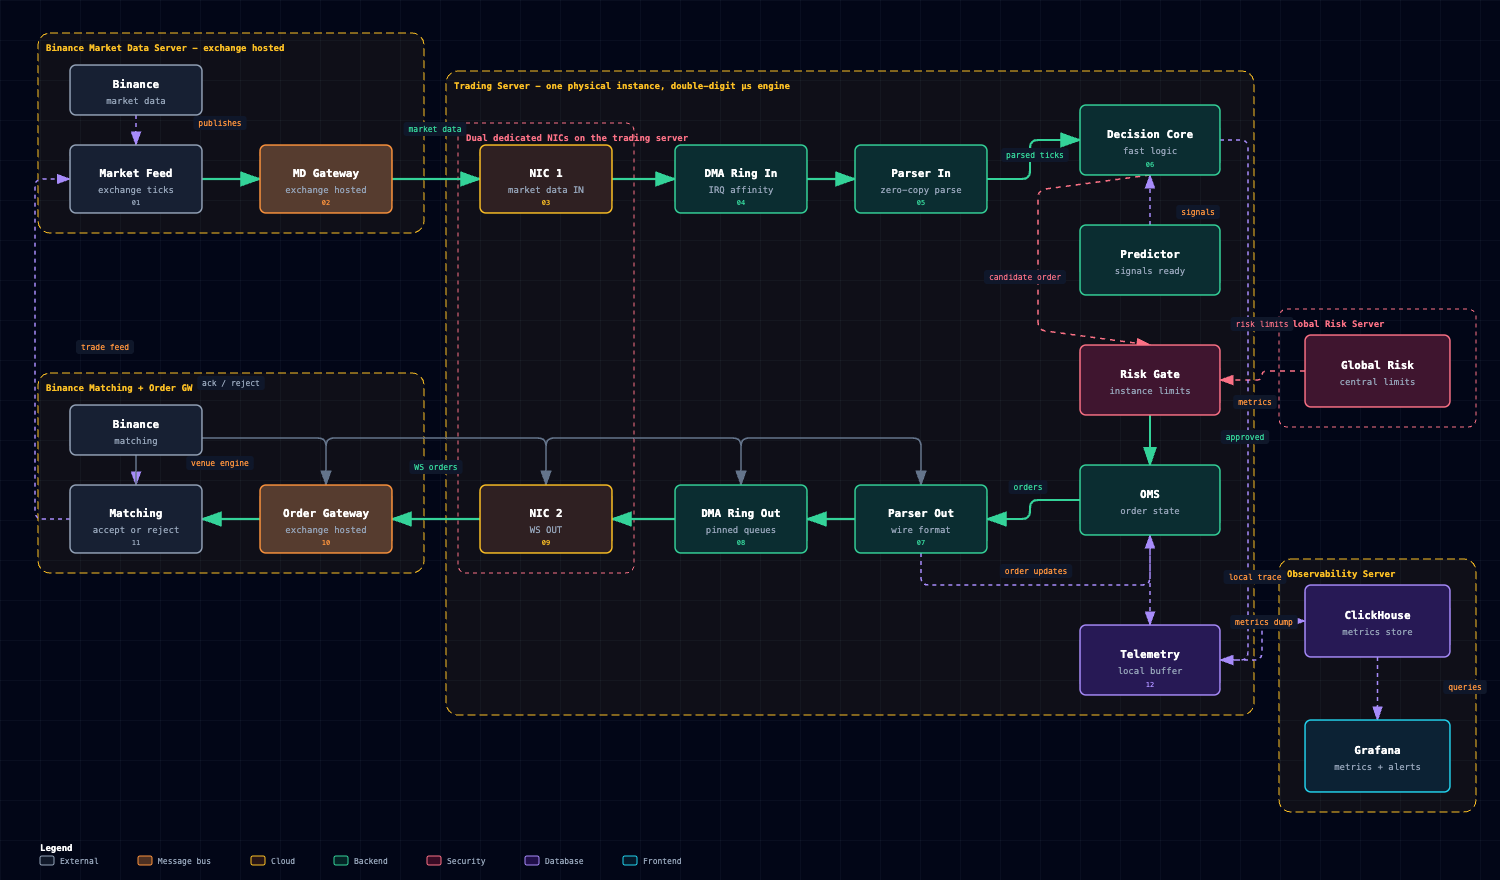
They are the result of many controlled decisions across the full market-data and order path: exchange setup, API permissions, network route, host tuning, kernel behavior, Rust hotpath design, WebSocket/session handling, strategy execution, OMS, risk checks and telemetry.
The low-latency trading diagram at the beginning of this section is a measurable model of where time is spent, where reliability can fail, and which stages Chronix can observe, govern or optimize.
The important product message is simple: Chronix understands where latency appears, where reliability can fail, and which parts of the path can be measured, governed and improved.
Low-latency trading quality is not only about writing a fast strategy. A desk also needs stable exchange sessions, correct private-stream handling, predictable CPU and memory behavior, reliable reconnects, rate-limit awareness, risk controls and telemetry that proves where time is spent.
This is why Chronix should be positioned as live trading infrastructure, not only as a terminal UI.
Full Order-Flow Map
Section titled “Full Order-Flow Map”Chronix can reason about the full path from exchange market data to local processing, strategy decision, order submission, acknowledgements, fills and operational monitoring.
The main stages are:
- Exchange side: account setup, API keys, permissions, venue-specific WebSocket and REST behavior, matching-engine events, acknowledgements and fills.
- Network path: server placement, route selection, colocation, dedicated lines, peering and venue proximity where available.
- Host and kernel path: NIC receive/transmit path, DMA/ring behavior, IRQ affinity, kernel tuning, CPU isolation and predictable resource usage.
- Adapter hotpath: WebSocket/session handling, venue-specific parsing, SBE/JSON decode, protocol normalization and low-copy Rust data paths.
- Internal runtime path: HFT-oriented channels, bounded queues, lock-free or low-copy handoff and predictable strategy access to hot market data.
- Strategy and risk path: strategy decision loop, live/paper/replay boundaries, pre-trade checks, validation and exposure controls.
- Order path: OMS state management, order serialization, submit/amend/cancel workflows, connector-specific order send, acknowledgement parsing, fill processing and order-state updates.
- Observability path: timestamps, latency samples, connector health, errors, abnormal states, alerts and Grafana views for technical and business metrics.
Chronix Latency Flow
Section titled “Chronix Latency Flow”The Chronix latency flow is a shared measurement model for the live market-data and execution loop. It shows how a desk can separate external venue/network latency from the stages Chronix can directly observe, govern and optimize.
It covers both sides of the live trading loop:
- inbound market-data latency through the Public Marketdata Adapter;
- exchange timestamp to adapter timestamp;
- adapter timestamp to strategy timestamp;
- local decision time inside strategy or clickGUI workflow;
- order-send path through the Private Trading Adapter;
- exchange acknowledgement and fill timestamps;
- full BBO-to-order round trip;
- kernel/userspace hops that Chronix controls;
- connector health, reconnect behavior and rate-limit state.
The latency flow turns “the system feels slow” into a measurable explanation: whether time was spent at the venue, in the network, inside the adapter, in the strategy loop, in OMS/risk or on the exchange acknowledgement path.
Reliability and Optimization
Section titled “Reliability and Optimization”Reliability is part of the same order-flow story. Chronix does not only try to reduce latency; it makes the live system more predictable, observable and recoverable, then uses that visibility to improve the path step by step.
The main areas Chronix can govern and optimize are:
- Exchange and API setup: permission scope, account configuration, API-key registration, venue-specific protocol behavior and rate-limit awareness.
- Session lifecycle: stable public/private streams, reconnects, resubscribe behavior and connector health.
- Network, host and kernel path: server placement, route selection, NIC behavior, IRQ affinity, CPU isolation and predictable resource usage.
- Adapter and runtime hotpath: venue-specific parsing, SBE/JSON normalization, low-copy Rust data paths, bounded queues and controlled backpressure.
- Strategy and order path: hot market-data access, predictable decision loops, pre-trade risk checks, OMS state, order serialization, acknowledgements and fills.
- Observability and audit: timestamps, latency samples, abnormal-state alerts, execution audit trail and Grafana views that show where time is spent.
Operational Questions Chronix Can Answer
Section titled “Operational Questions Chronix Can Answer”Because Chronix instruments the full latency flow, it can help answer practical production questions:
- Is the venue feed late?
- Is the local adapter late?
- Is the strategy reacting late?
- Is the order path slow?
- Are acknowledgements or fills delayed by the venue?
- Did reconnect behavior degrade the system?
- Are rate limits affecting execution?
- Is the system spending time in network, kernel, adapter, strategy, OMS or risk checks?
- Did a connector, account or venue leave its normal operating state?
- Is latency coming from a controlled internal stage or from an external venue/network condition?
The client-facing message is stronger than a generic “fast system” claim: Chronix knows where speed and reliability come from. It can measure the full trading path, explain where time is spent, govern the critical order flow and improve each stage deliberately.